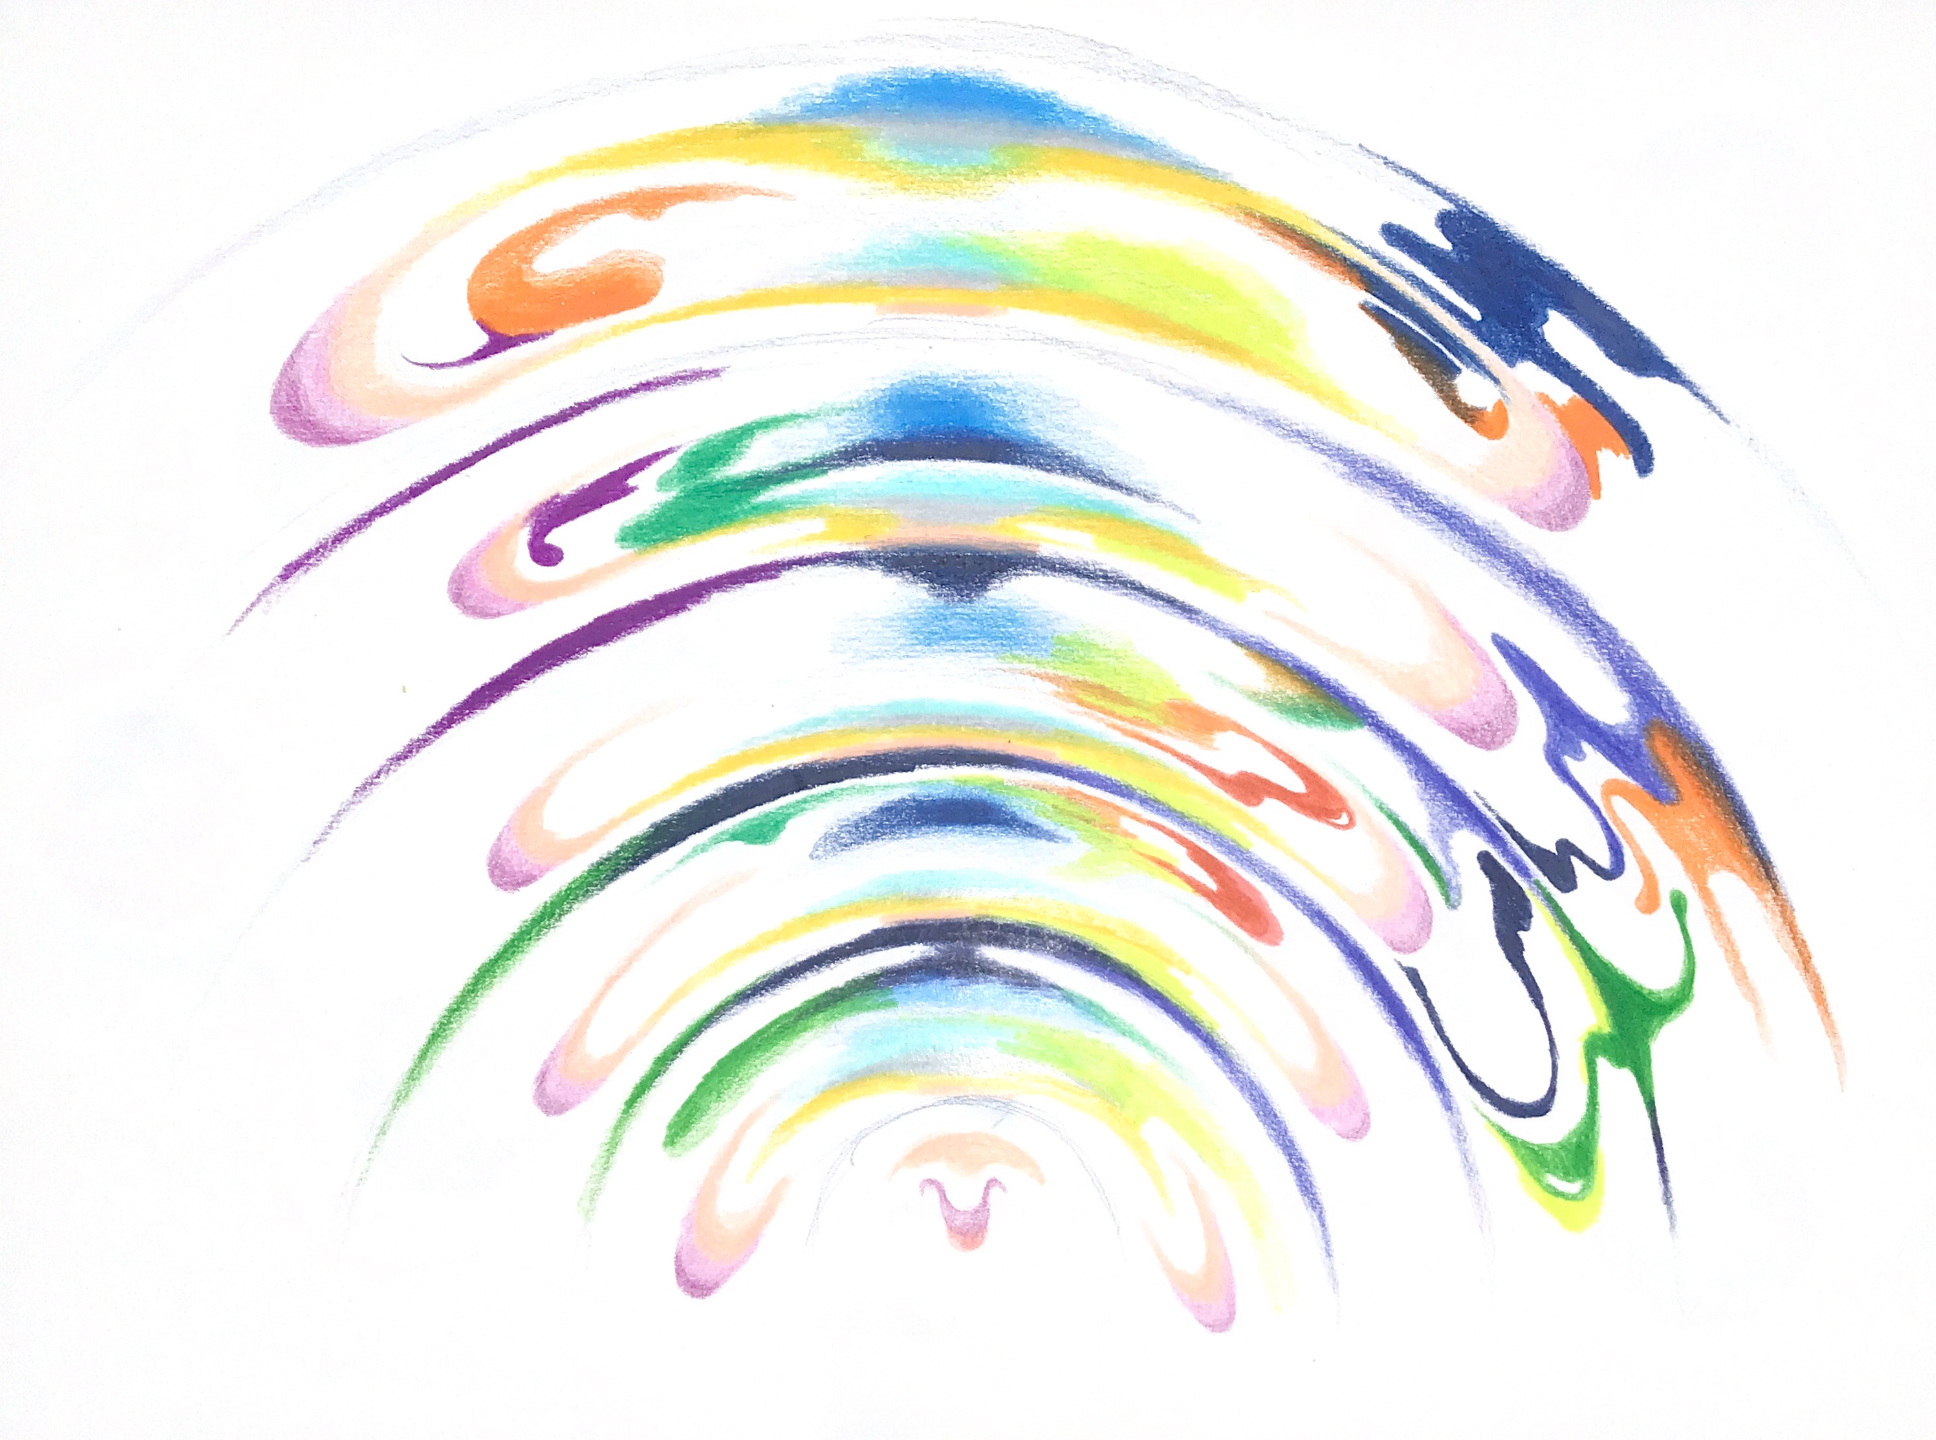
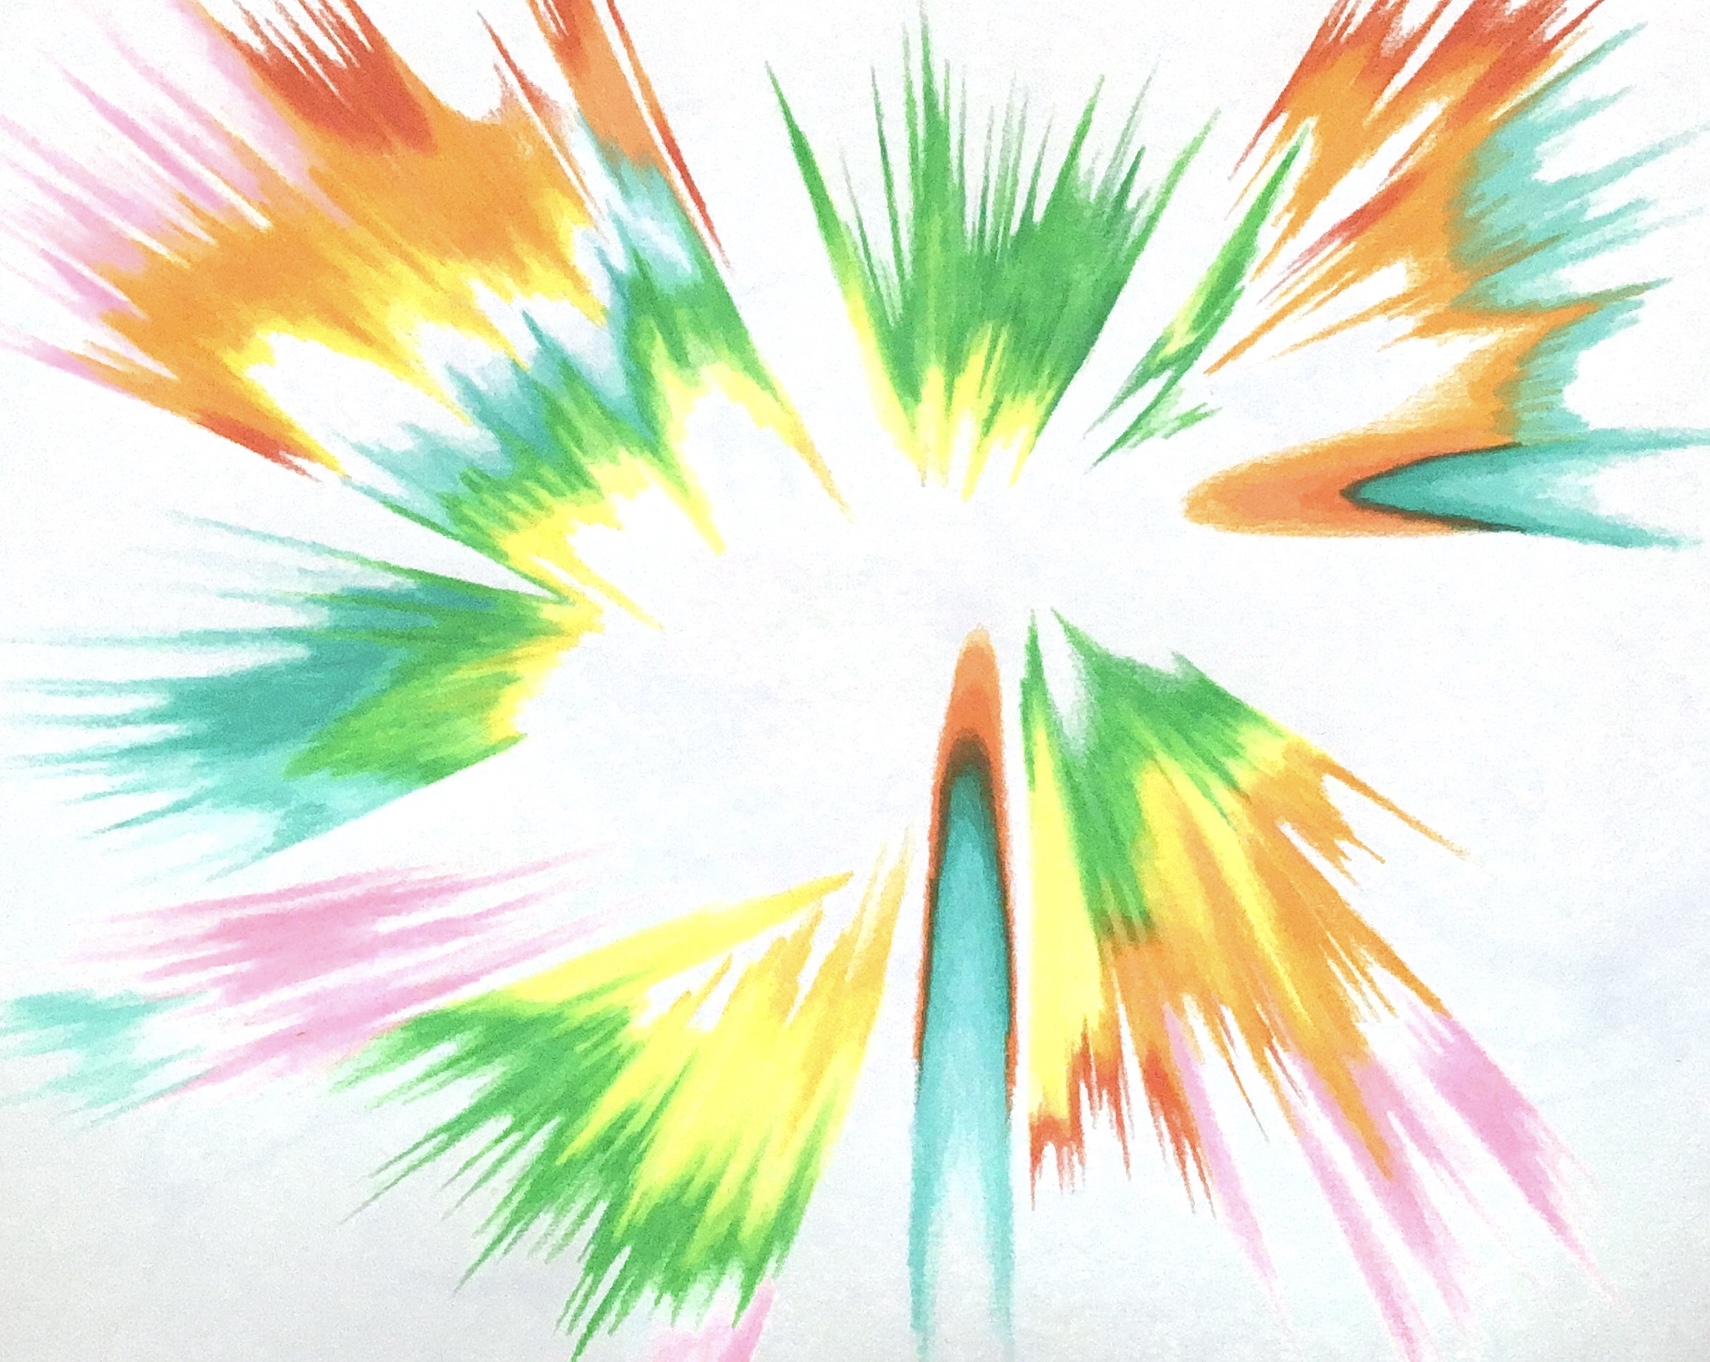
Analogue-digital interface: developing patterns
For my research to explore the whole MRI process, I needed to investigate the point where the analogue signals are converted into a digital biomedical image that accurately represents internal anatomy. This is achieved through computational and mathematical processes, which seemed magical to me. I call this the analogue-digital interface, where RF pulses become part of matter-energy and informational transformations. The mathematical tools used include Fourier transforms (FTs) and their friends k-space and inverse Fourier transforms (IFT).
LE / 1957
The Analogue-Digital Interface
FTs are mathematical devices that decompose complex periodic functions into a sum of sine and cosine waves almost like a frequency un-mixing machine. FTs can take apart and identify the individual sine waves that make a complex signal. Metaphorically speaking, FTs unpick ‘a chord’ and identify the ‘individual notes’ that compose it. FTs operate from within a mess of analogue signals emerging from the body which they transform into a digital cross-section of the body. Highlights in the History of the Fourier Transform by Alejandro Domínguez (2016) explains that in mathematics an FT is “a function or signal as a superposition of sinusoids” (p. 53).
An FT will select multiple frequencies, adding them together until the total waveform resembles the signal. FTs are a widespread, specialist type of mathematics needed in signal analysis and whose step-by-step operations can only be depicted and revealed numerically. There will always be a limit to how closely we can represent their operations. FTs operate from within a mess of analogue signals emerging from the body, transforming into a digital cross-section of the body, taking apart and reconfiguring the different properties of a wave and arranging/rearranging these properties according to specific temporal and spatial configurations. An FT will analyse a signal by selecting multiple frequencies and re-combining them until the synthesised waveform resembles the signal. FTs are a widespread, specialist type of mathematics needed in signal analysis and whose step-by-step operations can only be depicted and revealed numerically. There will always be a limit to how closely we can represent their operations
The illustration below shows signal analysis at work. This image visually explains how a continuous signal (the squiggly top line) such as an NMR signal can be represented by a sum of carefully chosen sine waves. The different sine waves added together will create the top squiggly line.

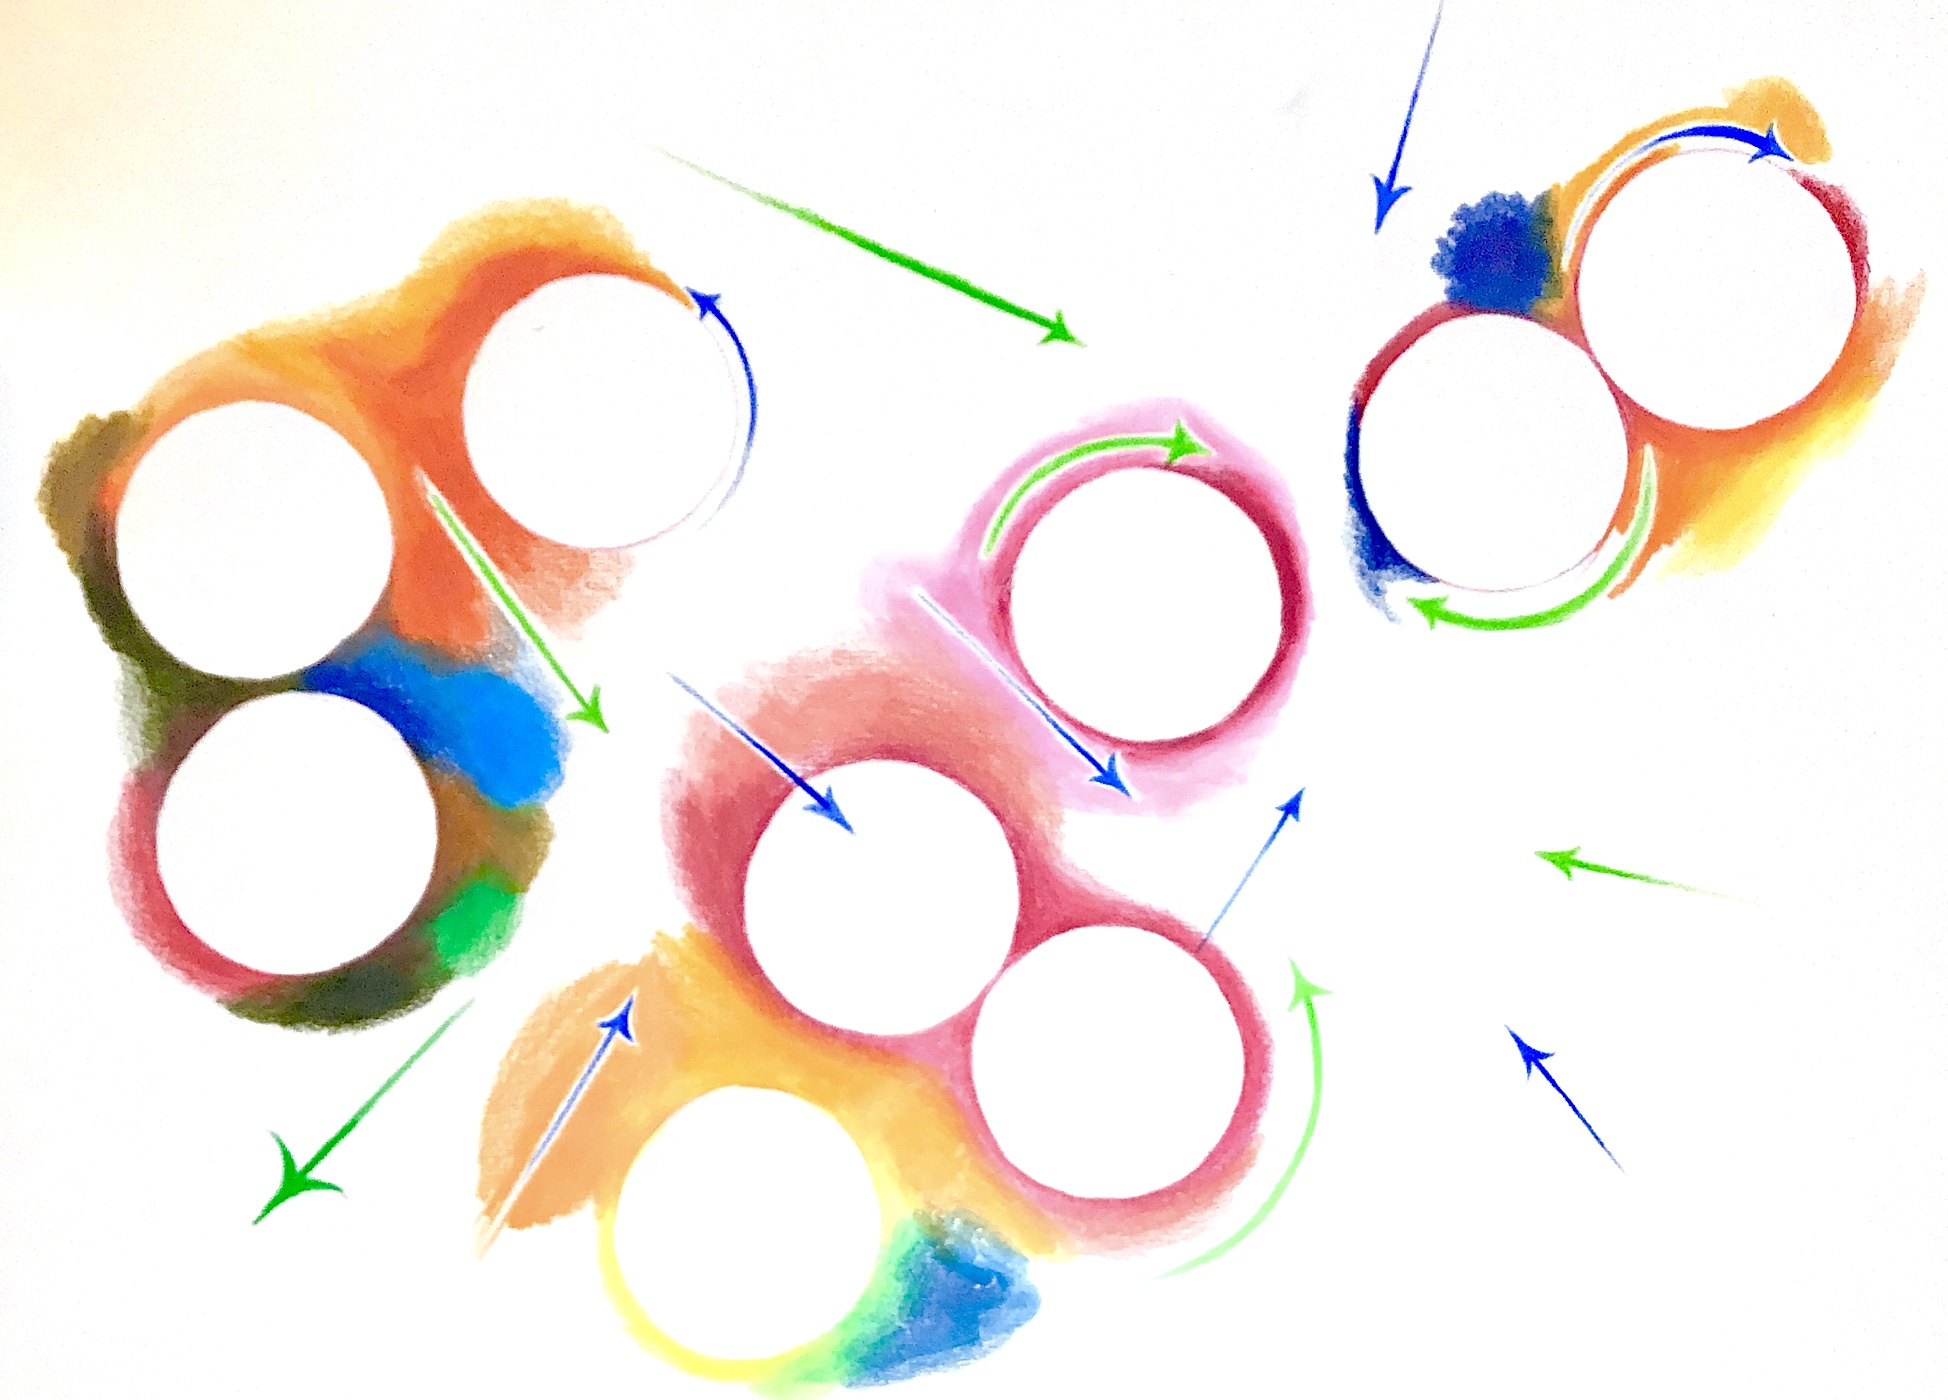
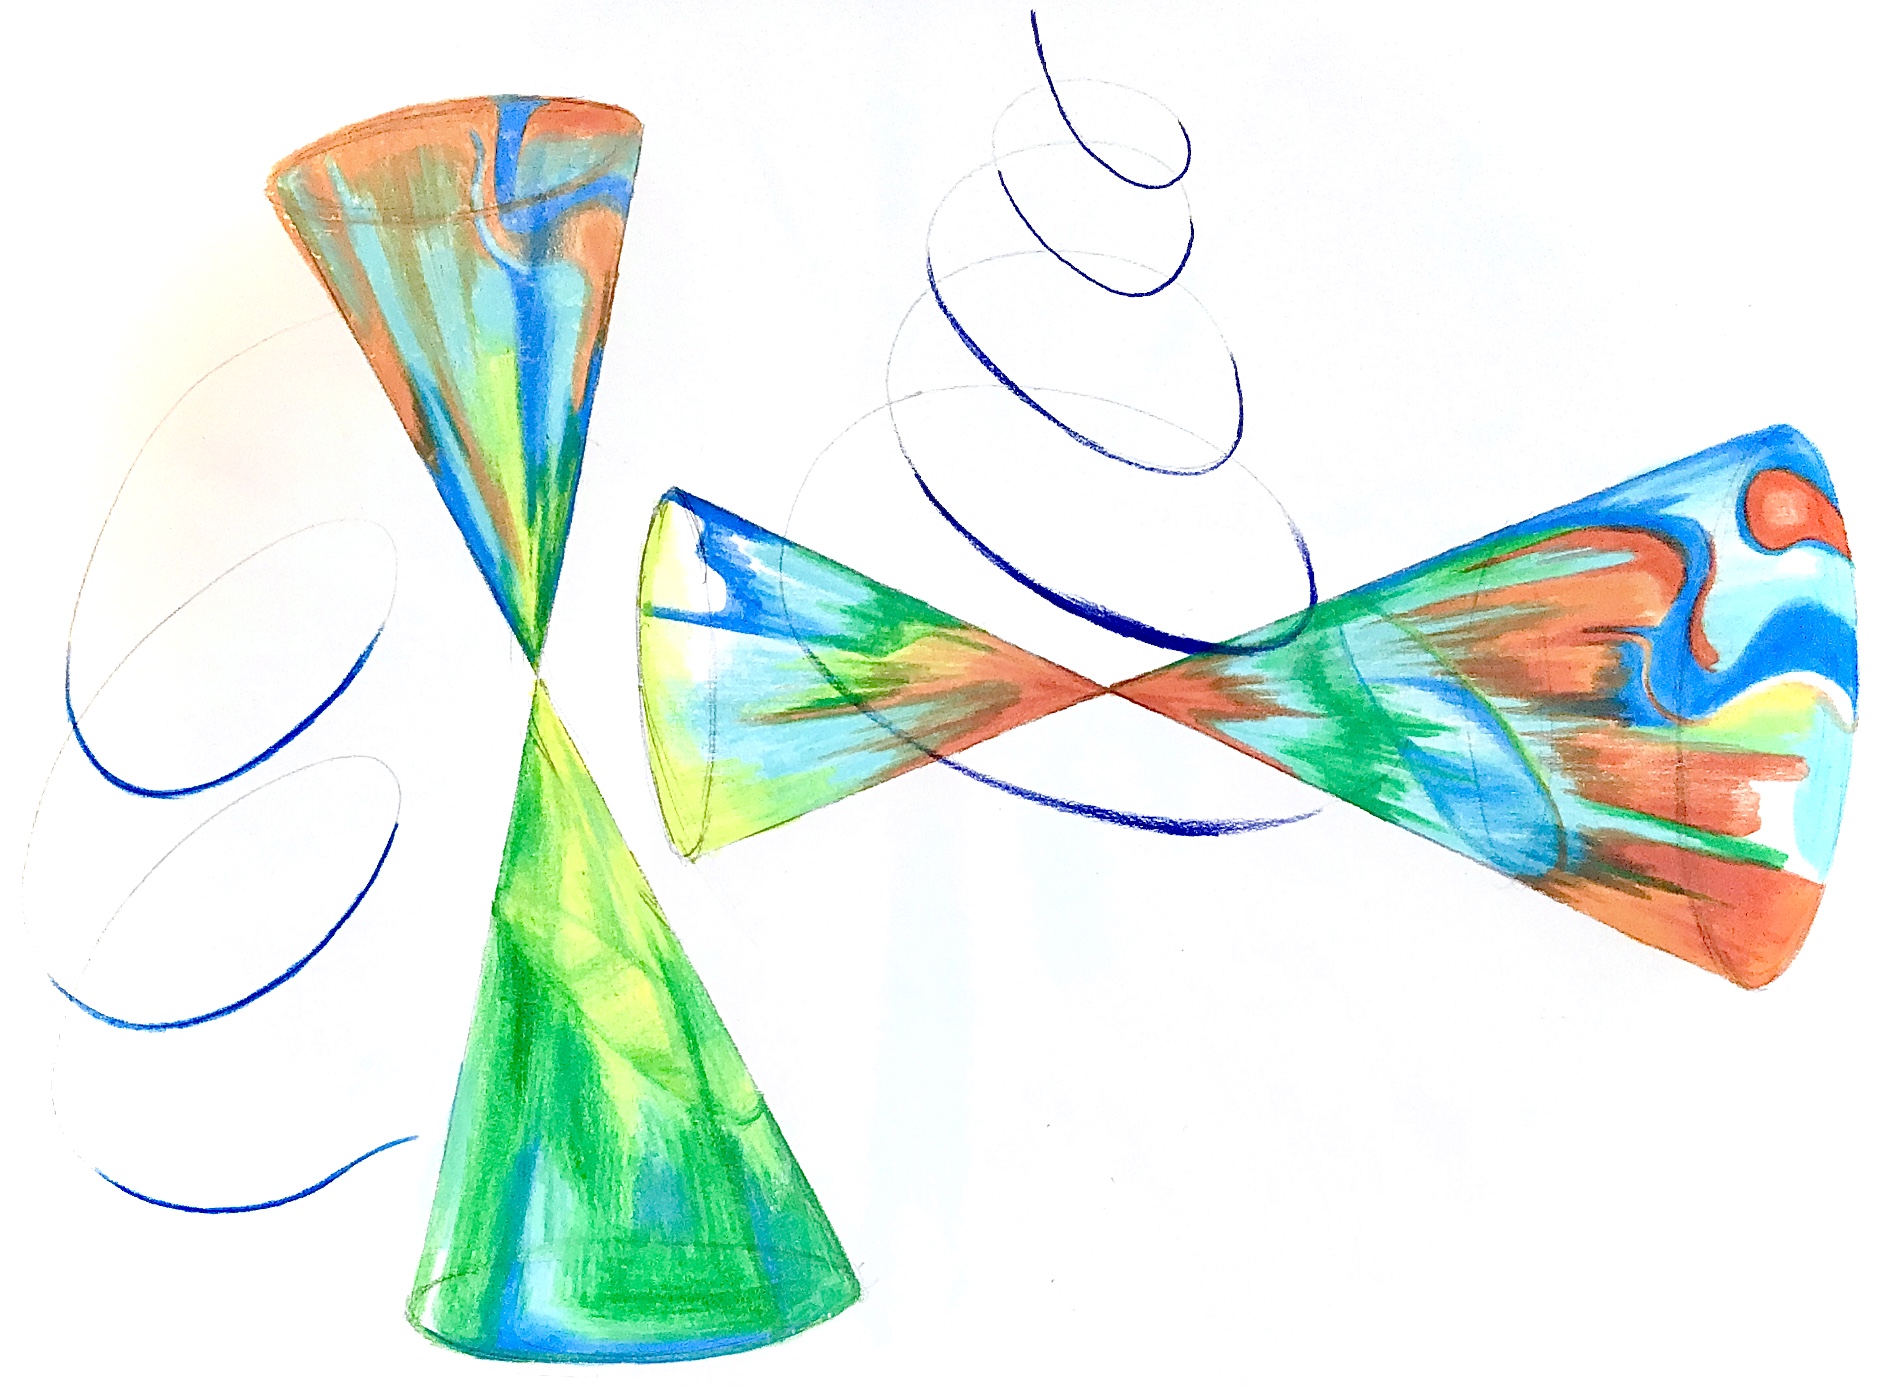
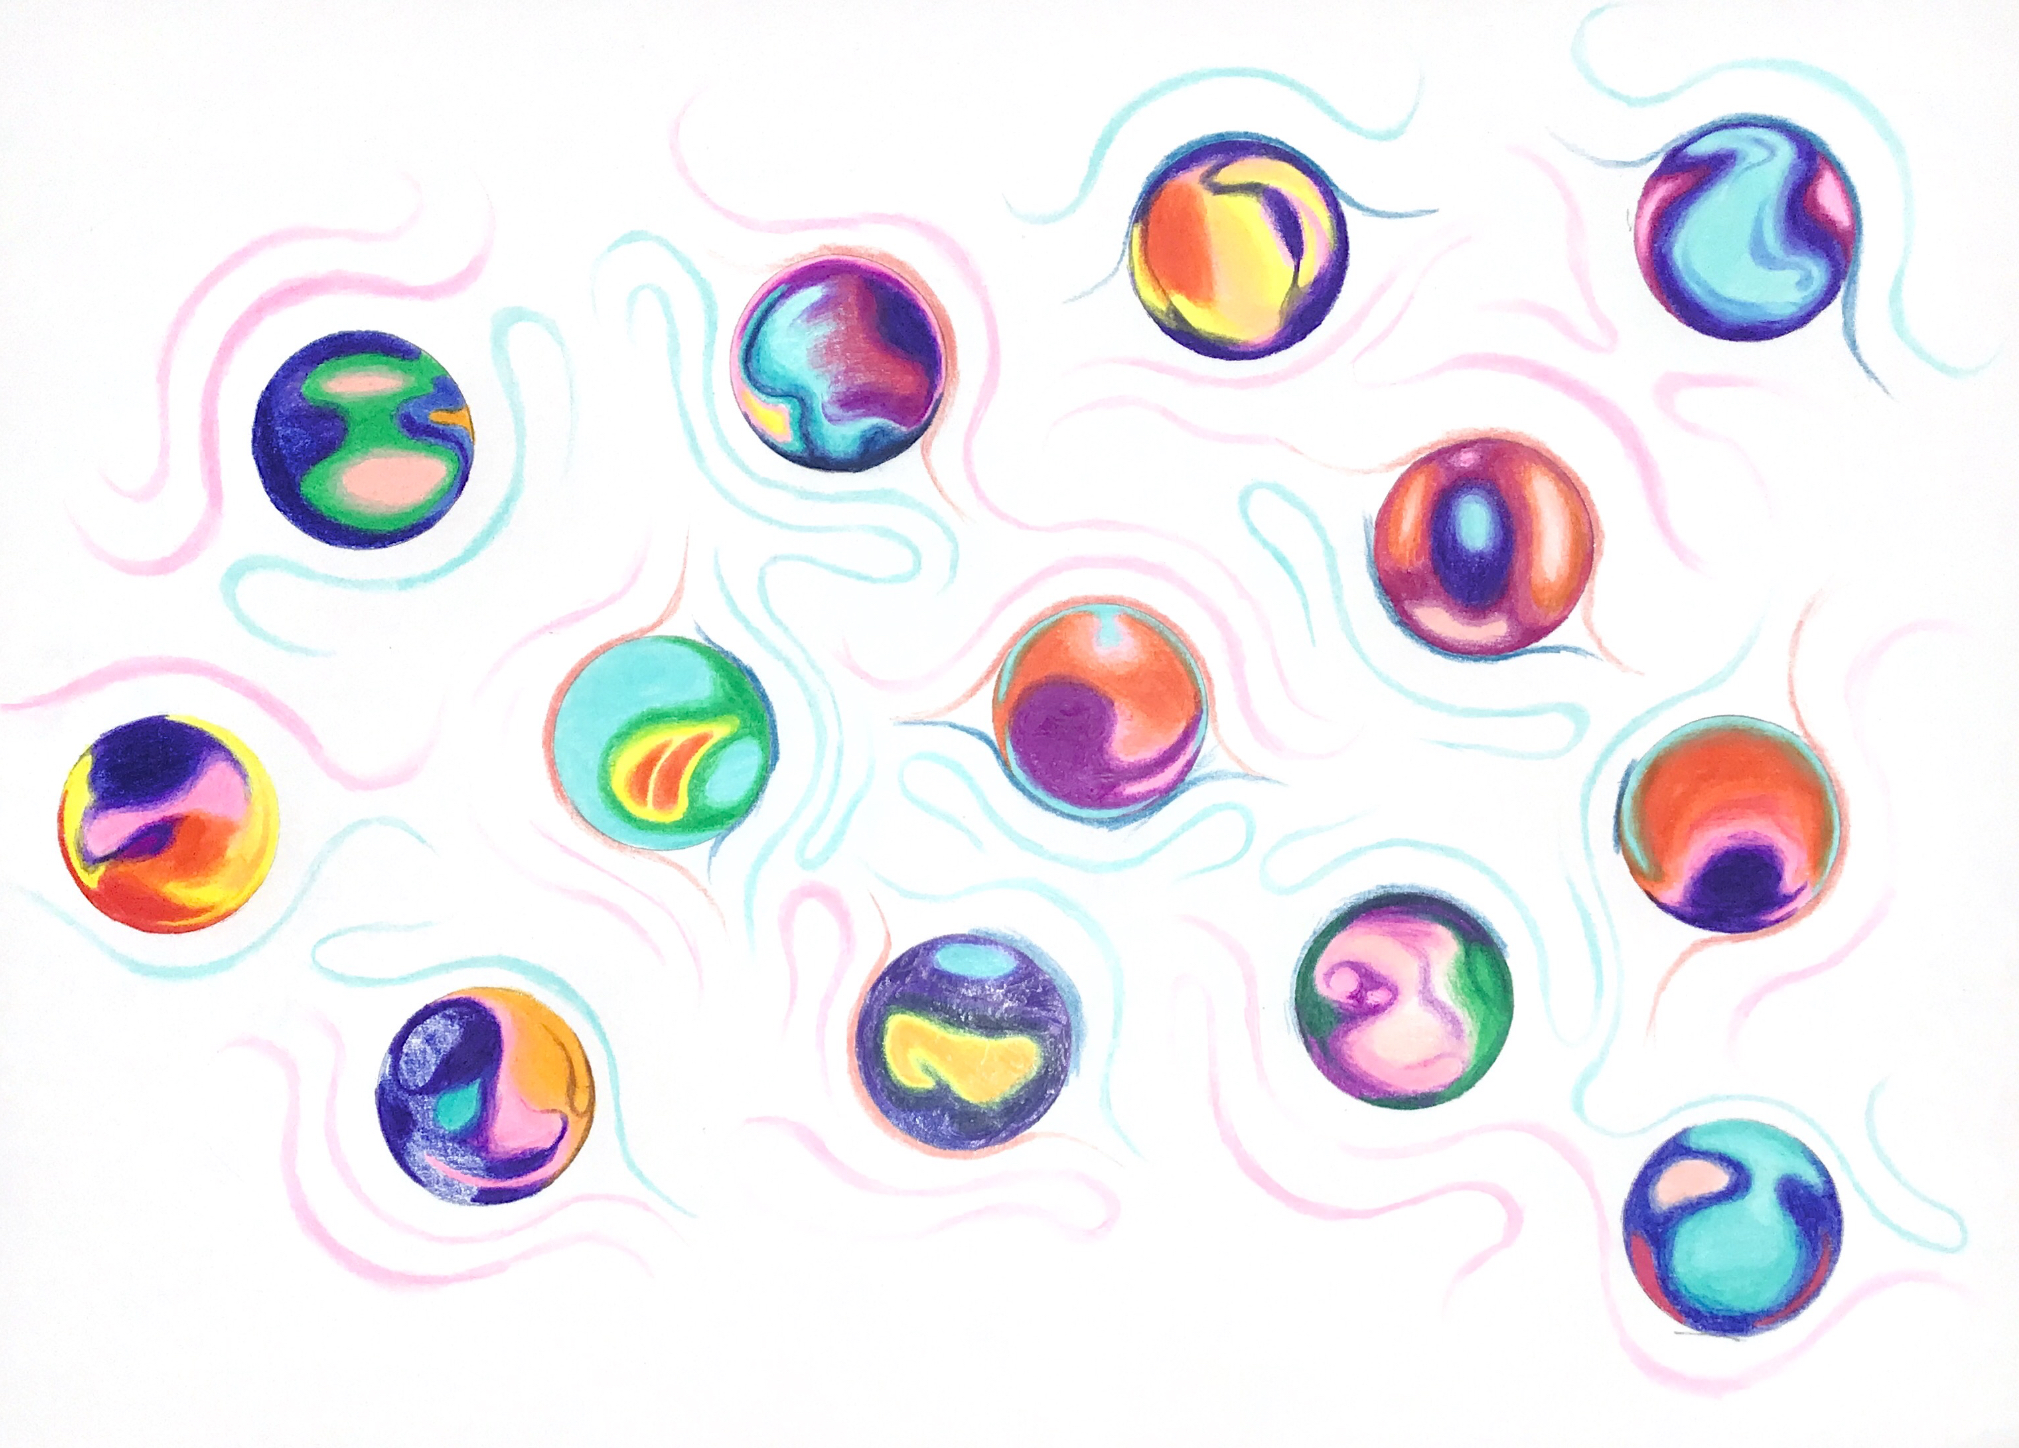
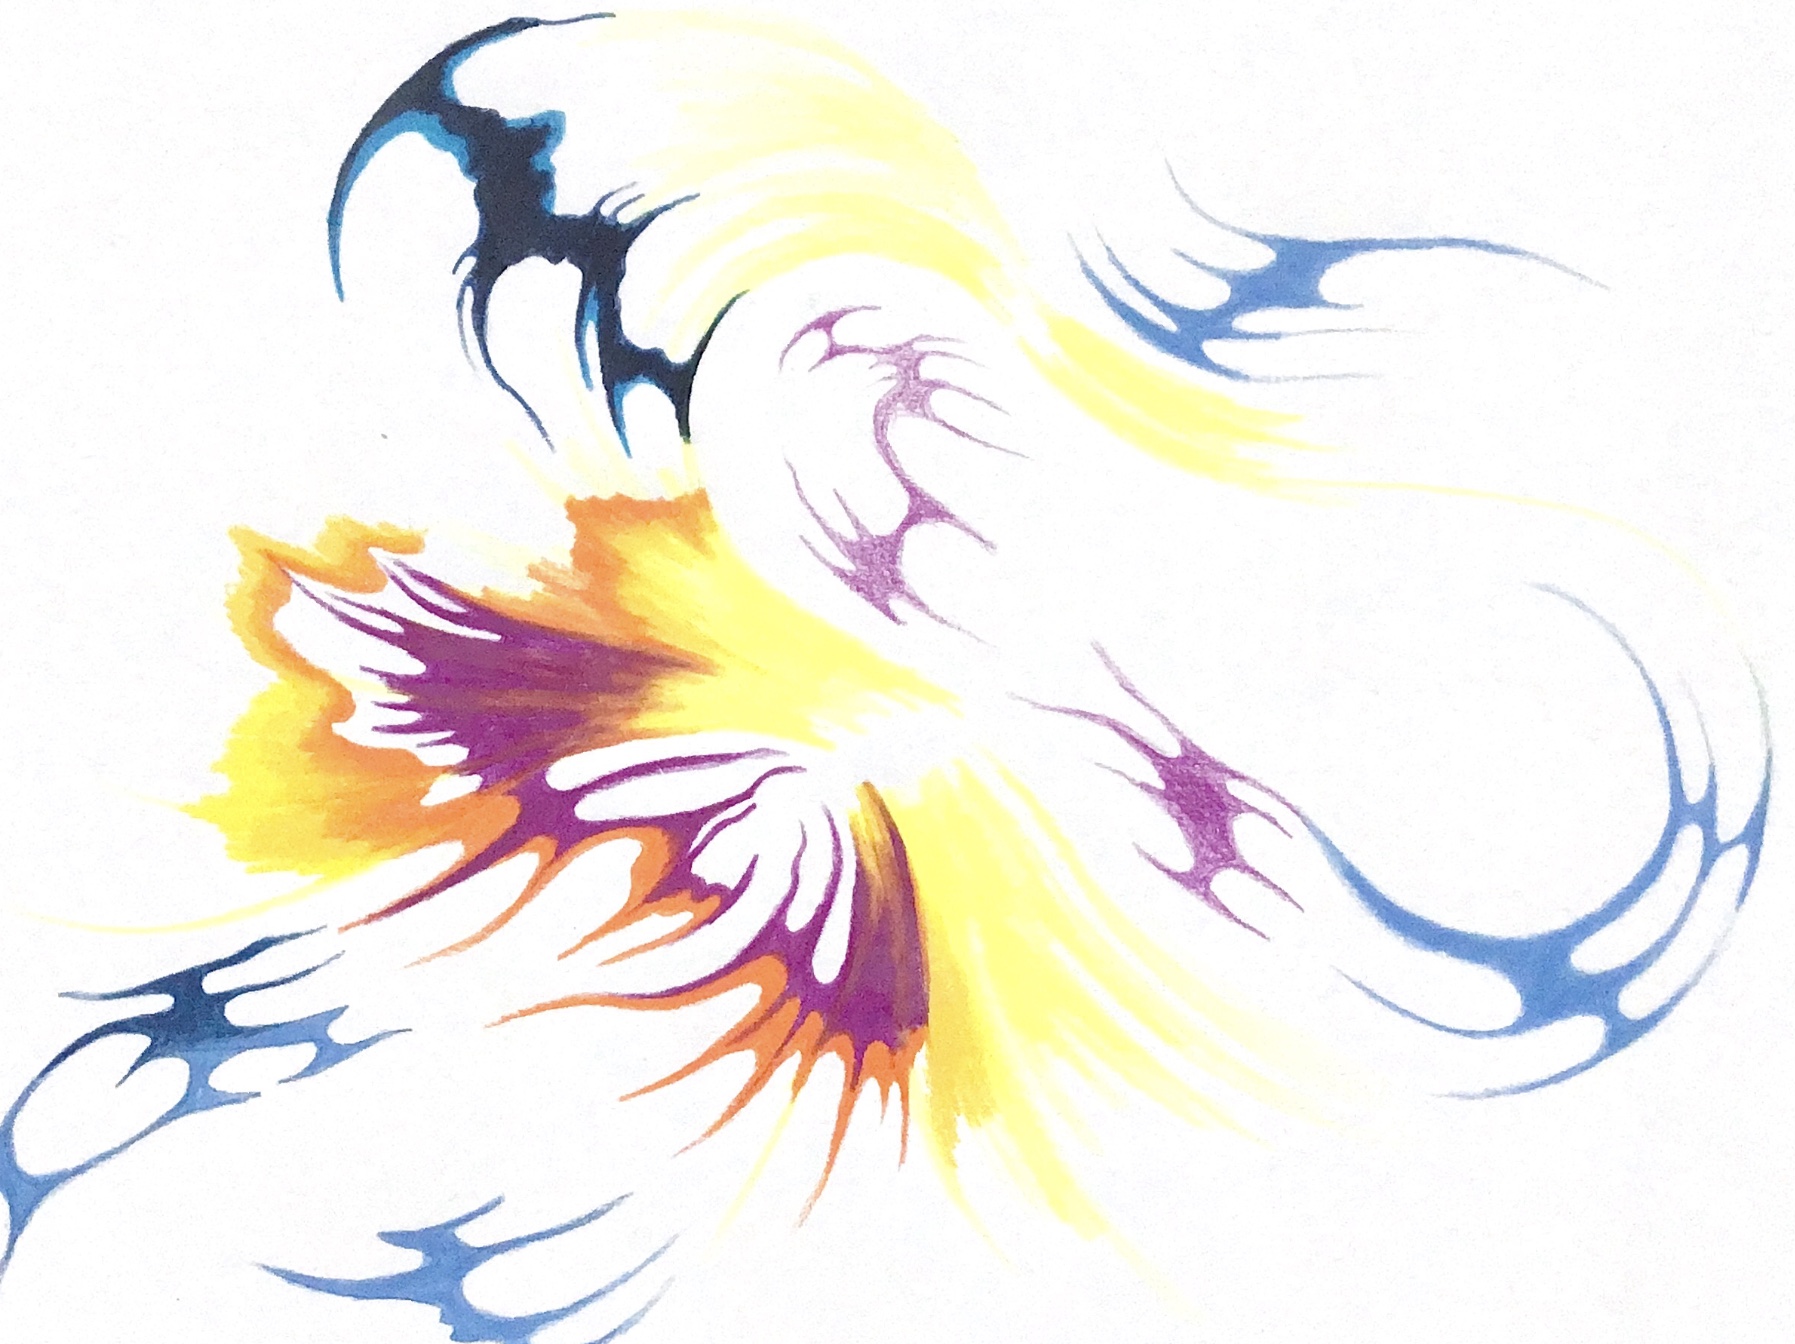
In MRI, FTs analyse (take apart) a signal as a function of time approximating multiple frequency components into a sum of sine waves of different frequencies that can then be spatially located and identified as originating from fat, water, pathological tissue or fluids in the body. IFTs reverse the FT and re-compose and synthesise the function of time from multiple frequency components. IFTs reconstruct the final image. They are mysterious to non-experts, and the only way to reveal the workings of FTs is through understanding the equations and various numerical stages of the analysis. There is a limit to what can be shown in the maths itself. Thinking of creaturely computational entities as materially embedded assemblages, I visually mapped the different properties and variables of the mathematical functions in MRI.
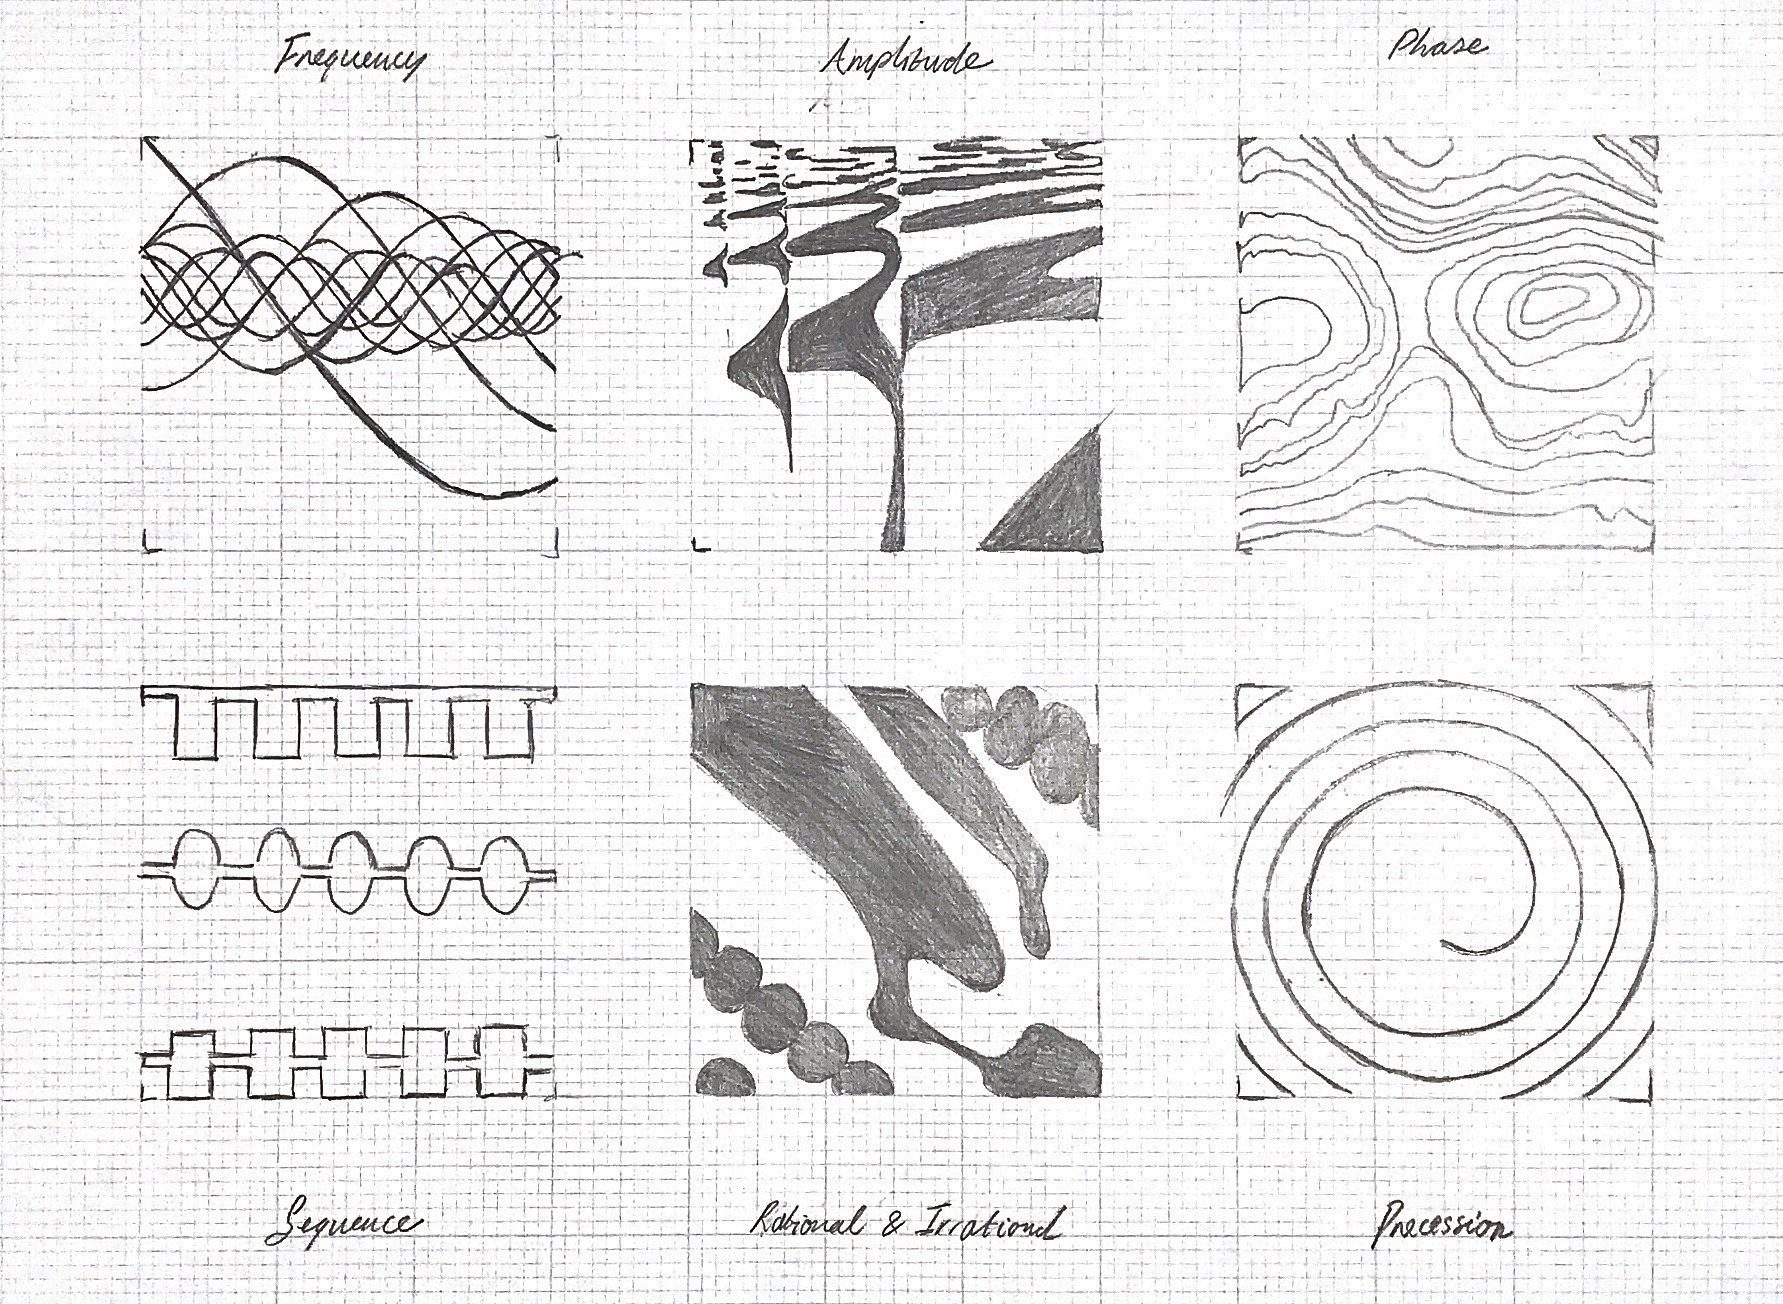
Being largely isolated from how computational technologies work, there is an increasing incentive to make their internal processes visible, particularly in a broader context where so much of the gig economy is exploitative and obscures the labour that produces electronics and services alike. The environmental, human and inter-species cost is also concealed behind the apparent seamlessness of big tech, AI and user experience design (see Anatomy of an AI). The lives lost in mines, extraction processes, factories and distribution hubs need to be a central concern. How we communicate and exchange our ideas and feelings is also being shaped by these technologies, this is also a form of unpaid labour.
FTs have significant applications in familiar digital, communication and sound technologies, and in technologies of visualisation including image processing, satellite surveying, crystallography and biomedical imaging. Their power to make seemingly inaccessible information pictorial makes them creaturely, it's almost as if they ‘work’ on the signals with some kind of autonomy. The computational/mathematical stages of MRI include mathematical functions FTs and inverse Fourier transforms (IFTs) and the use of a numerical matrix called k-space that contains information about the spatial properties of frequency and phase. All of which are creaturely in their transformational capabilities
Part of the mathematical computation of raw MRI data into a biomedical image includes the use of something called k-space. K-space is an array of numbers representing the spatial frequencies and is an extension of the concept of Fourier space. What k-space does is represent the spatial frequency information in two or three dimensions of an object. It enables the IFT to create the MRI spatial representation. K-space is a grid-based virtual space used for storing data before the creation of the MRI image, and the relationship between k-space data and image data is the Fourier transformation. The virtual nature of k-space is ultimately material: electronically mediated in the hardware of the computer connected to the MRI. Its ‘virtual’ nature is not due to immateriality but because it is the product of complex numbers which exist beyond the number line. The use of k-space enables MRI physicists and technicians to control the contrast of MRI images such that the spatial resolution of the image is given by the data present in the outer edges of k-space. It is the agent in MRI that controls spatial resolution, contrast, acquisition velocity and artefacts. This stage of the MRI process enables specific signals from specific tissue types to be located spatially and resolved into an image.

Proton Spin-Lattice Relaxation Time Map of Mouse
A billion years have gone into the making of that eye; the water and the salt and the vapors of the sun have built it; things that squirm
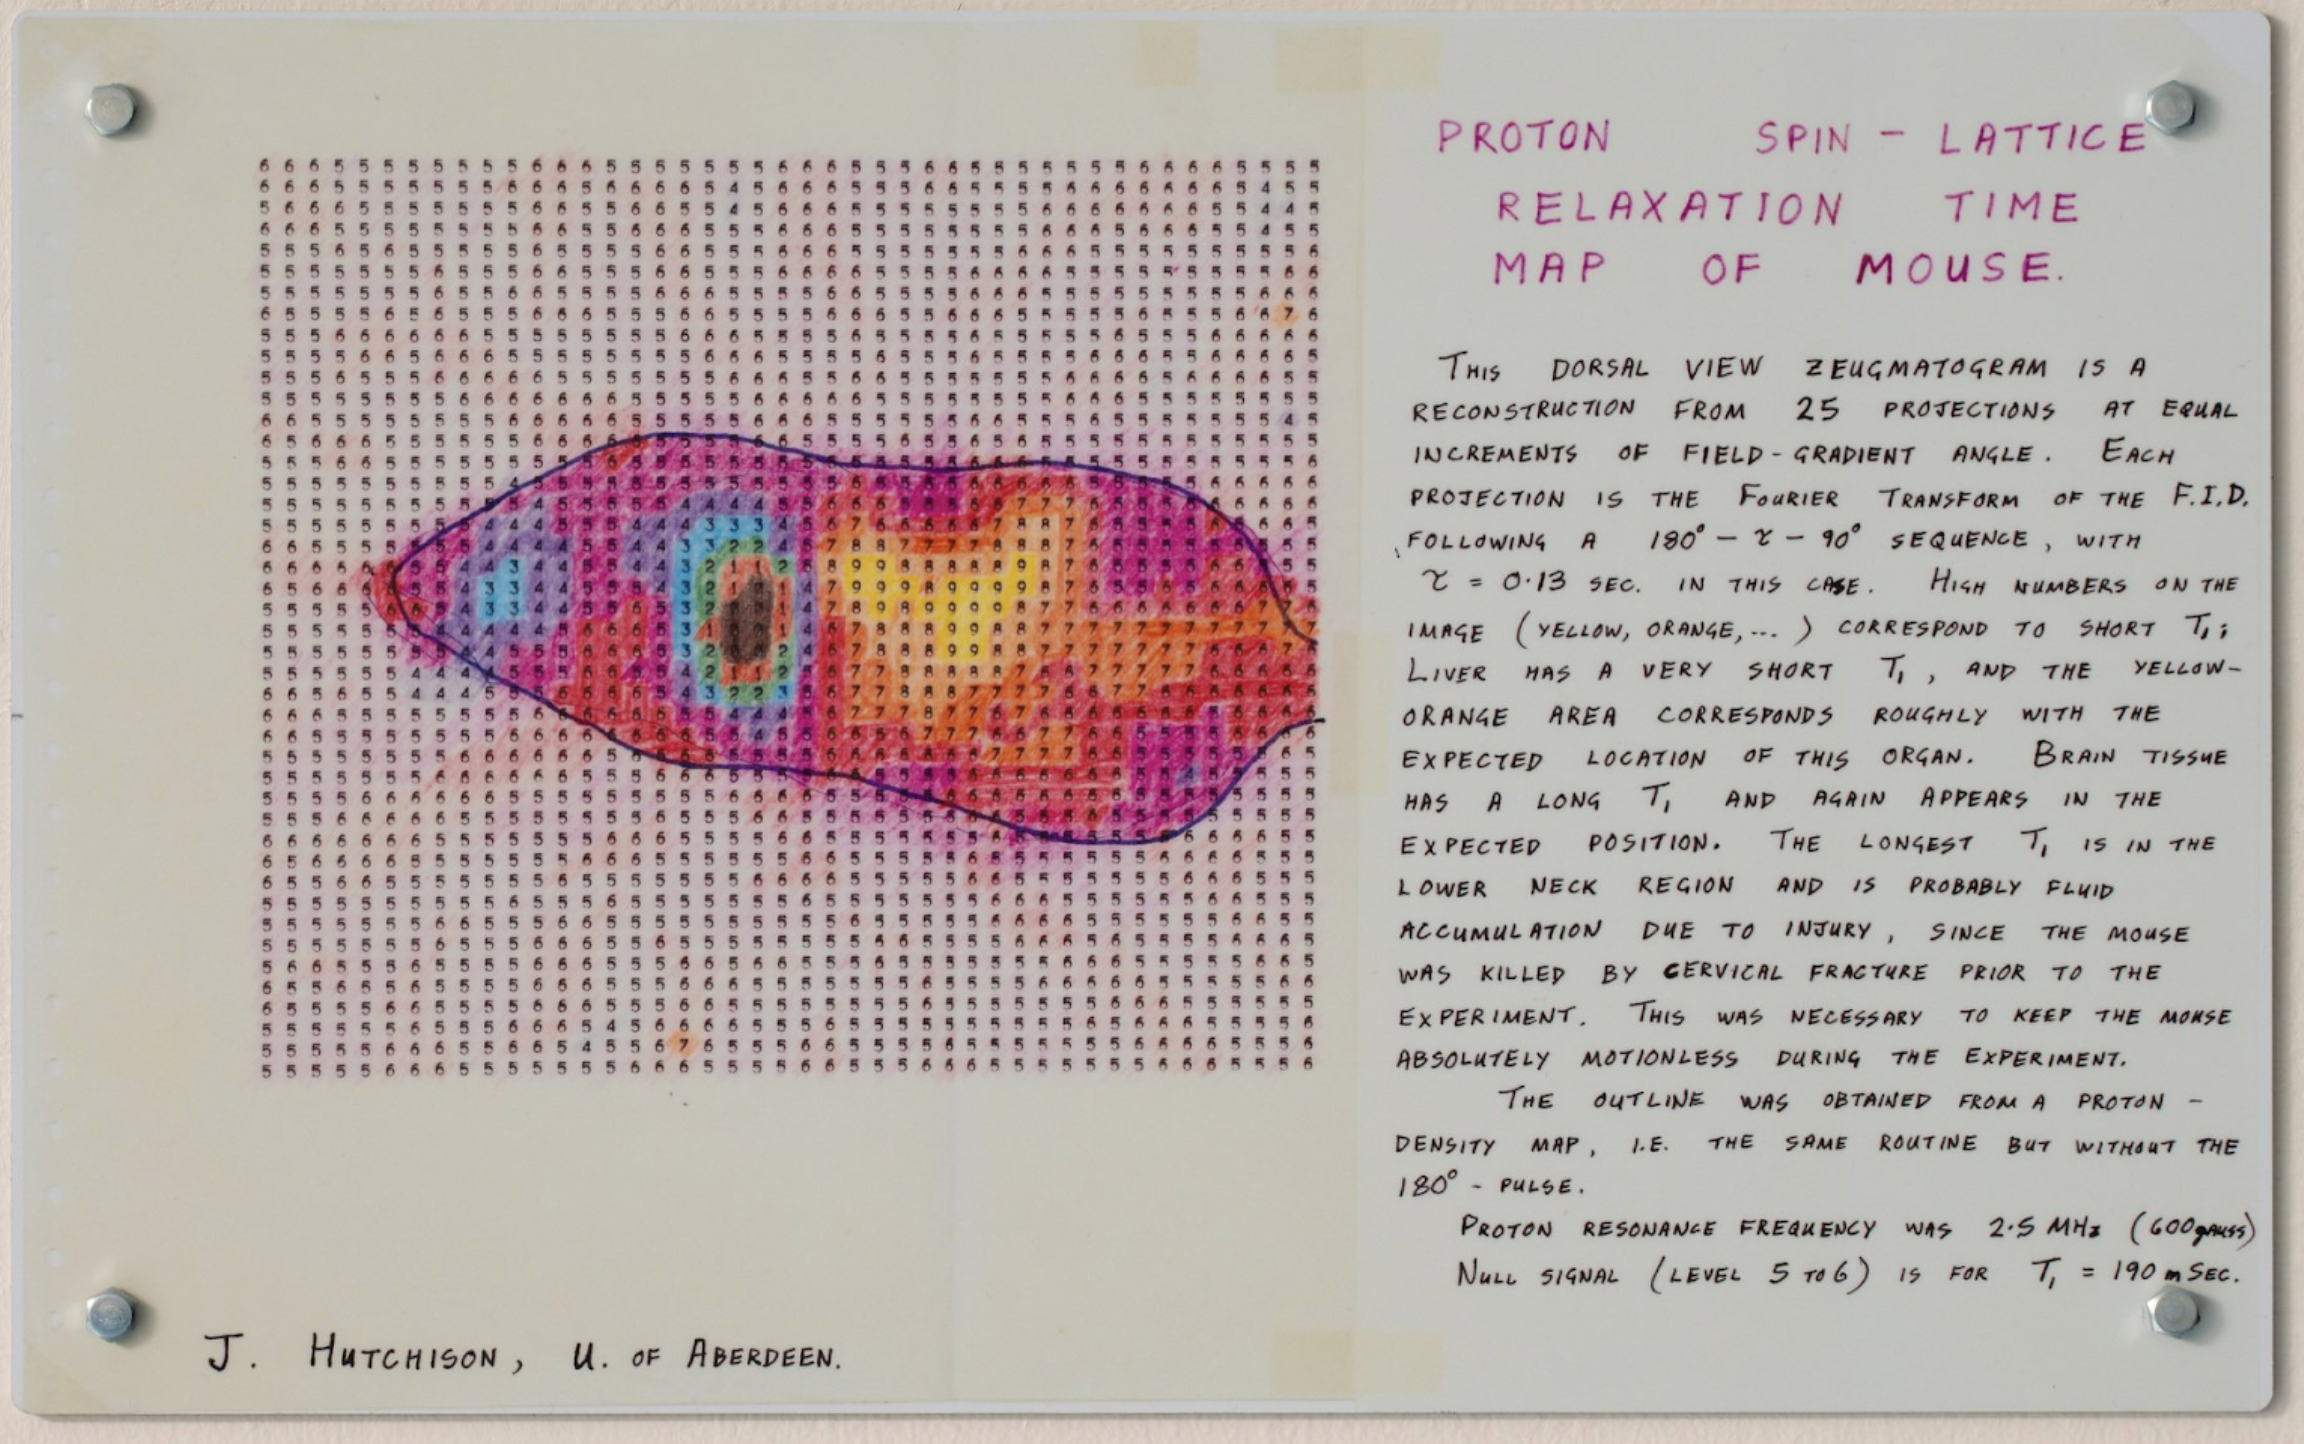
Proton Spin-Lattice Relaxation Time Map of Mouse
A billion years have gone into the making of that eye; the water and the salt and the vapors of the sun have built it; things that squirmed in the tide silts have devised it. Light-year beyond light-year, deep beyond deep, the mind may rove by means of it, hanging above the bottomless and surveying impartially the state of matter in the white-dwarf suns.
